Habe gerade eine fix für TWFlug hochgeladen, der auch eine neue Funktion hat.
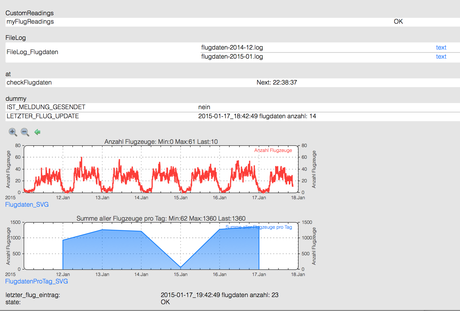
Es kann jetzt in Fhem die Summe aller Flugzeuge pro Tag angezeigt werden. Wird ein Flugzeug zwei oder mehrmals am Tag empfangen, wird es nur einmal in der Summe pro Tag berücksichtigt.
Es wird einmal am Tag kurz vor Mitternacht ein Eintrag in folgender Form geschrieben:
2015-01-05_23:59:41 flugdaten summe-pro-tag: 1296
Fix in Time Funktion, jetzt mit neuer 1.8 Time Api, LocalDateTime …
7700 Alarm Ausgabe in Konsole
In Fhem kann dann diese Grafik ausgegeben werden:

Flugzeuge pro Tag
Hier der nötige Eintrag in der twflug.cfg Datei:
# die Grafik mit der Logdatei verbinden für die Anzahl Flugzeuge pro Tag
define FlugdatenProTag_SVG SVG FileLog_Flugdaten:myFlugProTag:CURRENT
attr FlugdatenProTag_SVG room Flugdaten
Die myFlugProTag.gplot Datei:
/*
   myFlugProTag.gplot Version 1.0 vom 06.01.2015

   Dieses GNU-Plot Script zeigt die Flugdaten von den empfangenen Transpondern pro Tag an.

   Copyright (C) 2015 Thomas Wenzlaff http://www.wenzlaff.de

   This program is free software: you can redistribute it and/or modify
   it under the terms of the GNU General Public License as published by
   the Free Software Foundation, either version 3 of the License, or
   (at your option) any later version.

   This program is distributed in the hope that it will be useful,
   but WITHOUT ANY WARRANTY; without even the implied warranty of
   MERCHANTABILITY or FITNESS FOR A PARTICULAR PURPOSE.  See the
   GNU General Public License for more details.

   You should have received a copy of the GNU General Public License
   along with this program.  If not, see {http://www.gnu.org/licenses/}.
*/

# Die Logdatei sieht wie folgt aus:

# 2015-01-05_23:54:43 flugdaten anzahl: 4
# 2015-01-05_23:59:41 flugdaten summe-pro-tag: 1296

set terminal png transparent size <SIZE> crop
set output '<OUT>.png'
set xdata time
set timefmt "%Y-%m-%d_%H:%M:%S"
set xlabel " "
set title 'Summe aller empfangene Flugzeuge pro Tag'
set ytics
set y2tics
set grid ytics y2tics
set ylabel "Anzahl Flugzeuge"
set y2label "Anzahl Flugzeuge"

#FileLog 4:summe-pro-tag\x3a:0:

plot "<IN>" using 1:2 axes x1y2 title 'Summe aller Flugzeuge pro Tag' ls l2fill lw 2 with lines
Welche Funktionen brauch ihr noch?
Ähnliche Artikel:
- Raspberry Pi: Wie können Flugzeugdaten in Fhem in real-time (Echtzeit) angezeigt werden?
- Testfreigabe: TWFlug 0.0.1 beta für DUMP1090 zur Auswertung von Flugdaten
- Wie kann ein Tür- und Batteriezustand gPlot für Fhem (HM-Sec-SC) erstellt werden?

